Outo
Project Information

User Scenario
In the exploration stage, we employed three methods for customer research, including: "surveys, user interviews, and contextual exploration," with the main purpose being:
To understand users' thoughts about the current website
To understand users' experiences and habits when purchasing trips online, so as to infer how to enhance users' willingness to purchase on the website
The second time she returned to the site to purchase tokens, things didn’t go as smoothly.
When Susan reached the invoice section, she was confused — she clearly remembered saving her preferred mobile barcode number the last time. Why was she being asked to enter it all over again? Feeling slightly annoyed, she wondered, “Do I really have to retype this every time I buy tokens?”

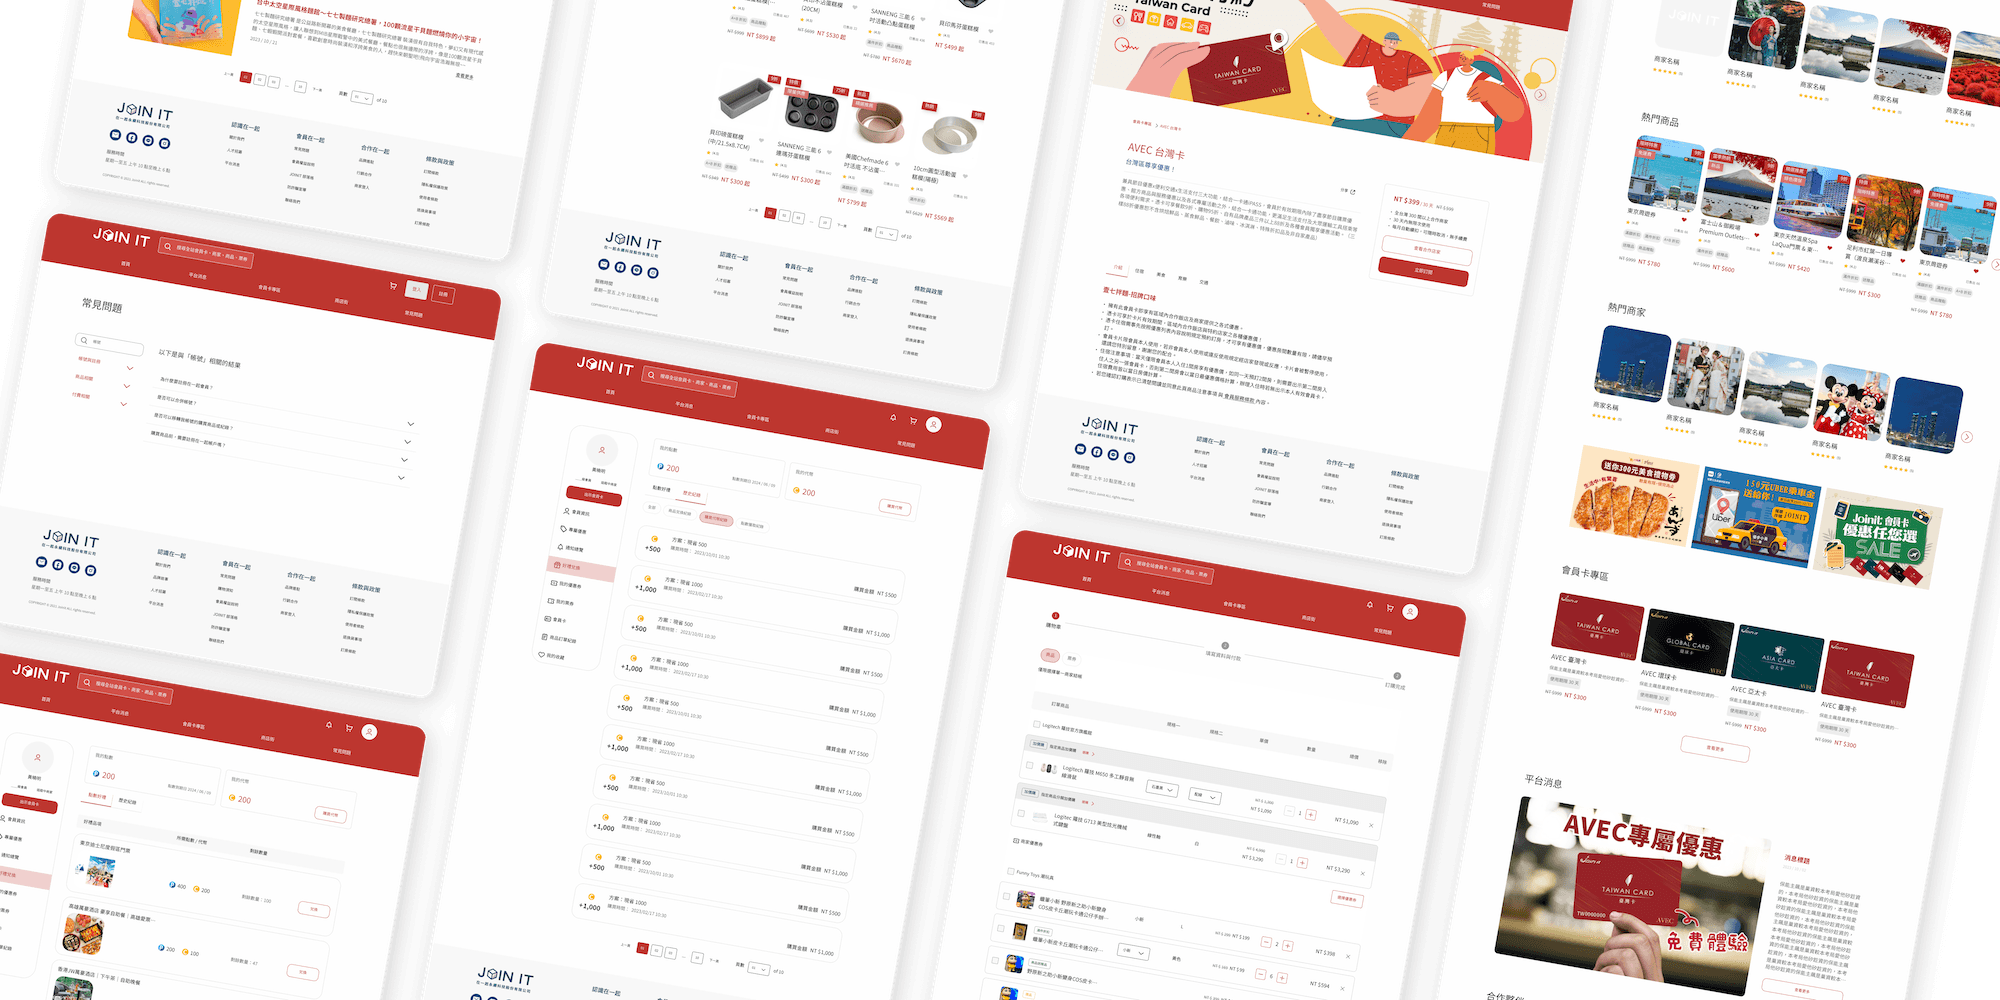
User Flow breaks down the user journey, optimizing key pages within it.
UI interface
Identified User Types
Main improvement content:
Based on user feedback on the website, improve UI design such as image buttons, CTA text, enhance the readability of the website, and optimize the presentation of information hierarchy, button hierarchy, search, and filter functions
According to the conclusions from User Flow, merge the selection area into the product introduction page, allowing users to confirm before placing an order that the desired travel time is bookable, avoiding user frustration
Invoice Option Design Strategy
To determine how invoice options should be displayed, we analyzed the different types of invoices and their required fields (as shown in the diagram). Our goal was to help users quickly recognize each option while avoiding overly long content in dropdowns and input fields that could hinder readability and aesthetic consistency.

We then aligned the option structure with user mental models:
Personal invoices: Through secondary research, we identified which subtypes are most frequently used by users. Mobile barcode which is the most common option is preselected by default to streamline the selection process.
Business invoices: According to usability heuristics, interfaces should minimize the user’s memory load. Company names are easier to recognize than tax ID numbers, so displaying the company name in the options list provides a more intuitive experience.
Donation invoices: Based on interviews with users who regularly donate invoices, most can easily recall the five-digit donation code and typically donate to the same one or two organizations. Therefore, displaying the donation code—rather than the full organization name—improves efficiency and speeds up user selection.

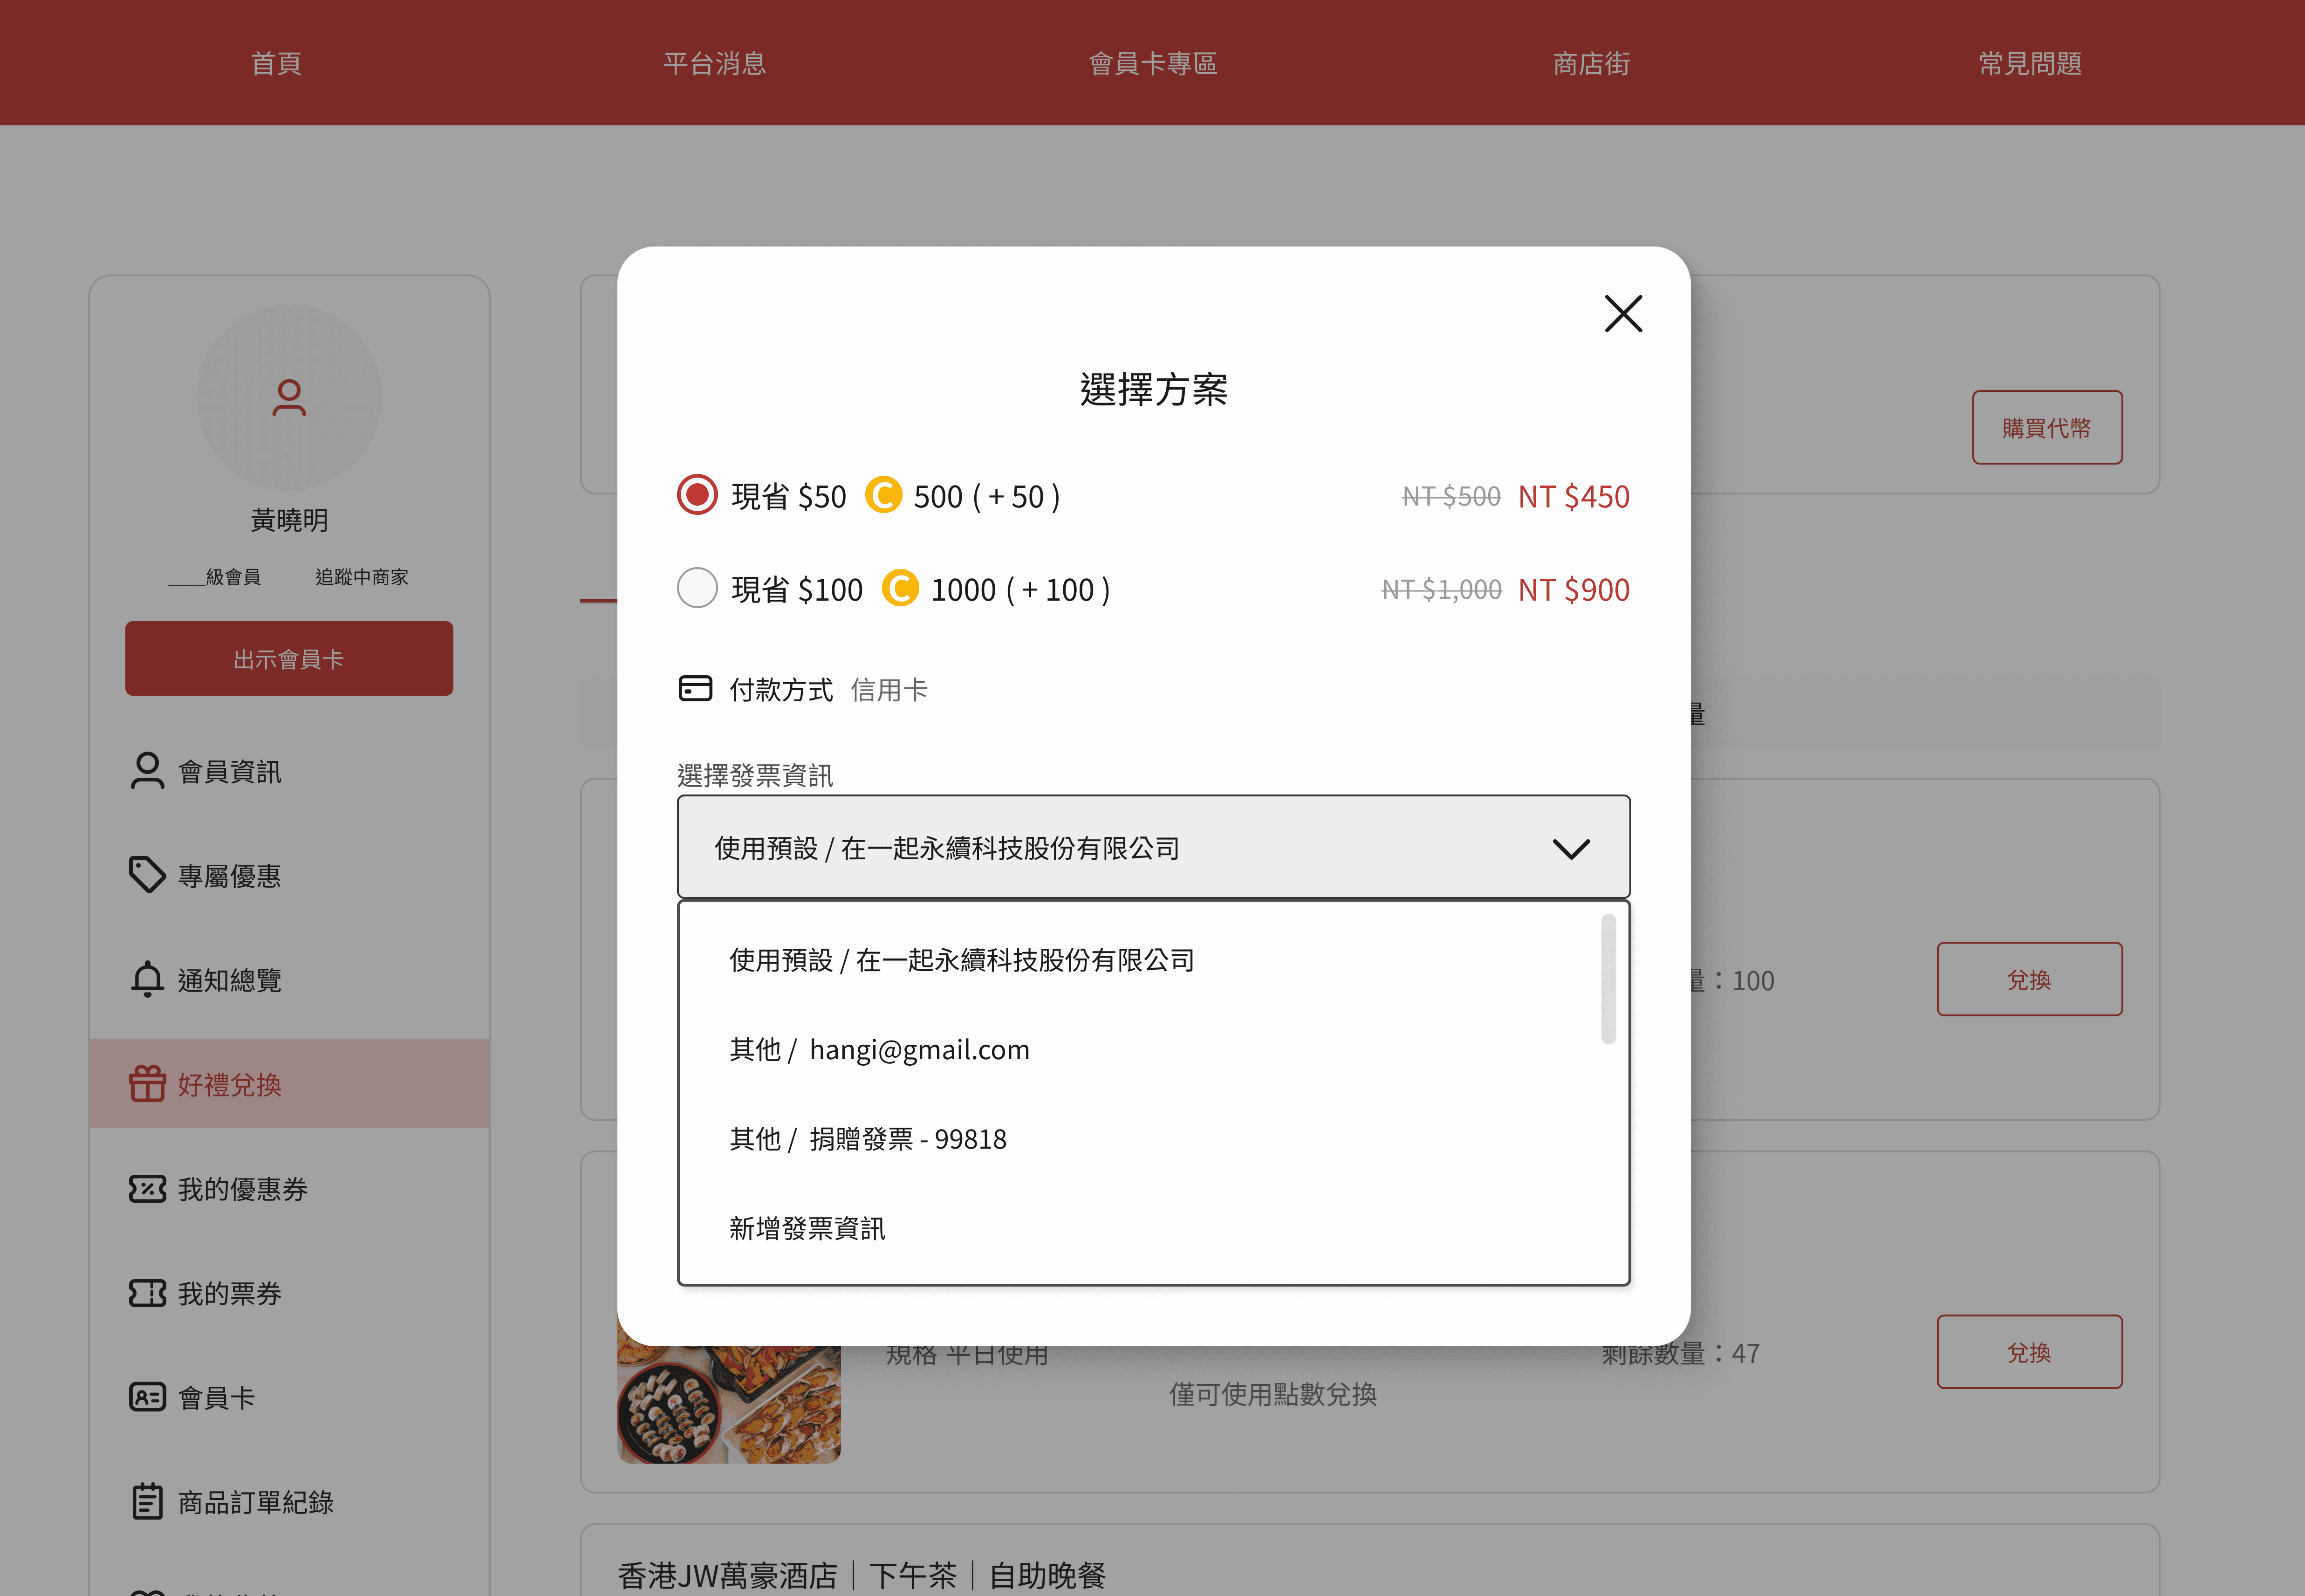
By mapping these user behaviors and mental models, we designed a selection interface that is both visually clean and user-friendly—ultimately enhancing the speed and accuracy of the invoice selection process.
UI Mockups

Learning and reflection
Interview Existing Customers: The respondents in this round have never used the Outo website. By asking users who have previously made purchases about their decision-making factors and their thoughts on the website when placing orders, more detailed insights can be gained.
Increase the Ratio of Quantitative Data: Compared to quantitative data, this project has more qualitative feedback. By increasing the ratio of quantitative data during user research and testing, the reliability of the feedback can be enhanced, making adjustments to the design direction more efficient.
Increase Communication Frequency with Stakeholders: The frequency of meetings for this project is about once a month, primarily for project progress reports. If the frequency can be increased to biweekly meetings, it will allow the overall direction of the project to be more focused and improve execution accuracy.
Check the WCAG Standard in Design: When the team is too focused on brainstorming and design, they may inadvertently overlook design guidelines. By incorporating relevant checks during execution, the quality of the project can be enhanced.